 developed this computer model showing Butte topography and the corresponding underground tunnels from the years of historic underground mining.")
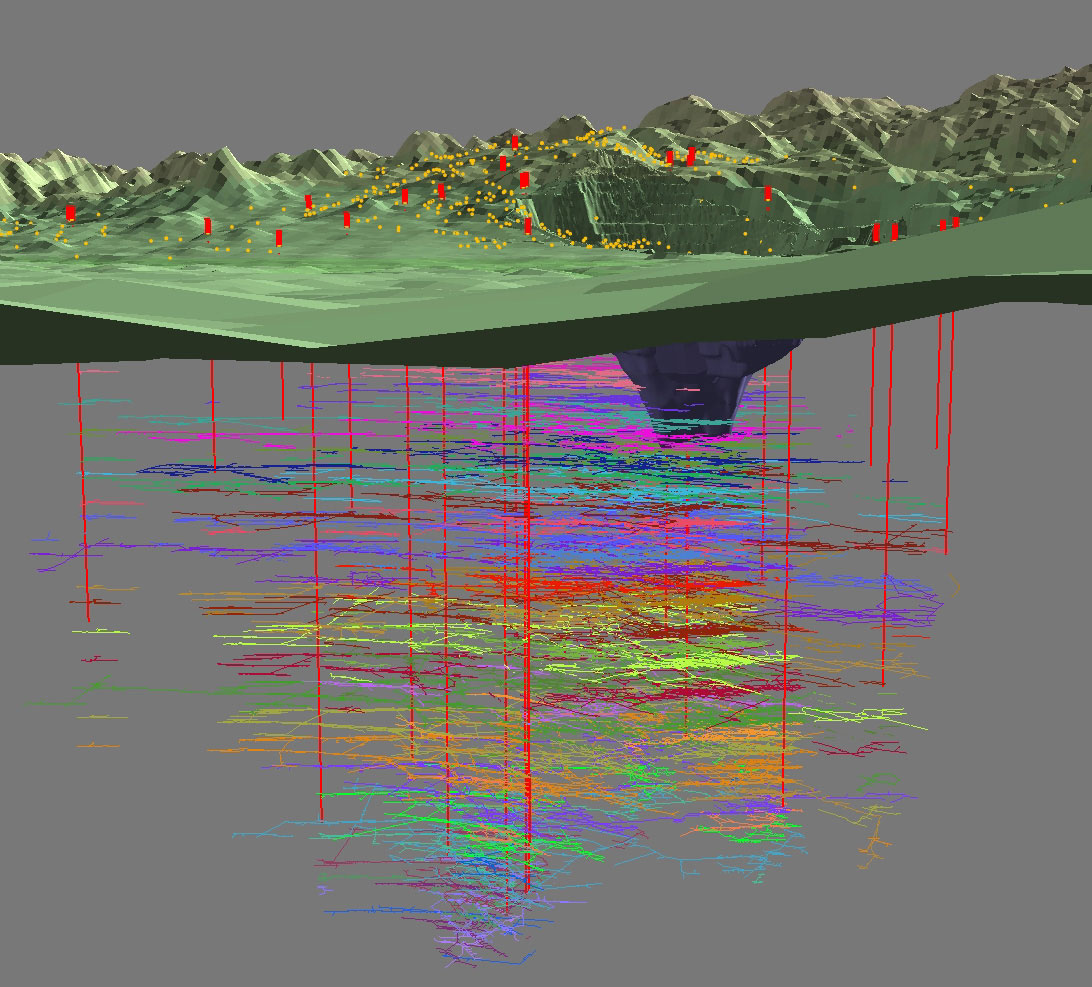
The Montana Bureau of Mines & Geology (MBMG) developed this computer model showing Butte topography and the corresponding underground tunnels from the years of historic underground mining. The red dots at the surface and red lines below represent vertical shafts, and the colored lines under the surface represent the horizontal levels of the mines. The graphic does not illustrate stopes or other lateral workings. The Berkeley Pit can be seen as the large depression at center-right. As illustrated, the deepest underground mines went down about one mile, far below the final depth of the Berkeley Pit.
The Montana Bureau of Mines & Geology (MBMG) developed this computer model showing Butte topography and the corresponding underground tunnels from the years of historic underground mining.
Note for teachers and educators: This image is also available on the third poster in the Berkeley Pit Educational Poster series.